
Can DCAF1 Keep Up With Cereblon?
Every second paper on PROTACs repeats the same phrase that lack of small molecule ligands capable of recruiting various E3 ligases is a major bottleneck for further evolution of TPD field, usually stating that out of 600+ E3 ligases we can recruit only a small fraction (currently around 5%). However, this phrase is becoming a cliché as the field is still mainly focused on two E3 ligases, CRBN and VHL, often ignoring the ligands for additional E3 ligases that have been disclosed in the last couple of years.
The issue is that most of the new E3 ligands are validated on only one or two highly degradable proteins, typically BRD4. So the real bottleneck is quietly shifting towards other questions.
Which E3 ligases and their ligands are actually useful for TPD field? And which one should I pick for my specific TPD project?
When a new E3 ligase looks promising on an easy target, is it actually broadly useful, or does it only work for the low-hanging fruit?
Together with my former team at the SGC (the Knapp group at Goethe University Frankfurt), with colleagues from Kiel University, NEOsphere and Merck (Darmstadt, Germany), we decided to address these questions. Some of the important outcomes we published recently in J. Med. Chem., where we thoroughly evaluated E3 ligase DCAF1 and its small molecule ligand previously developed by Novartis.
Why DCAF1 is interesting E3 ligase
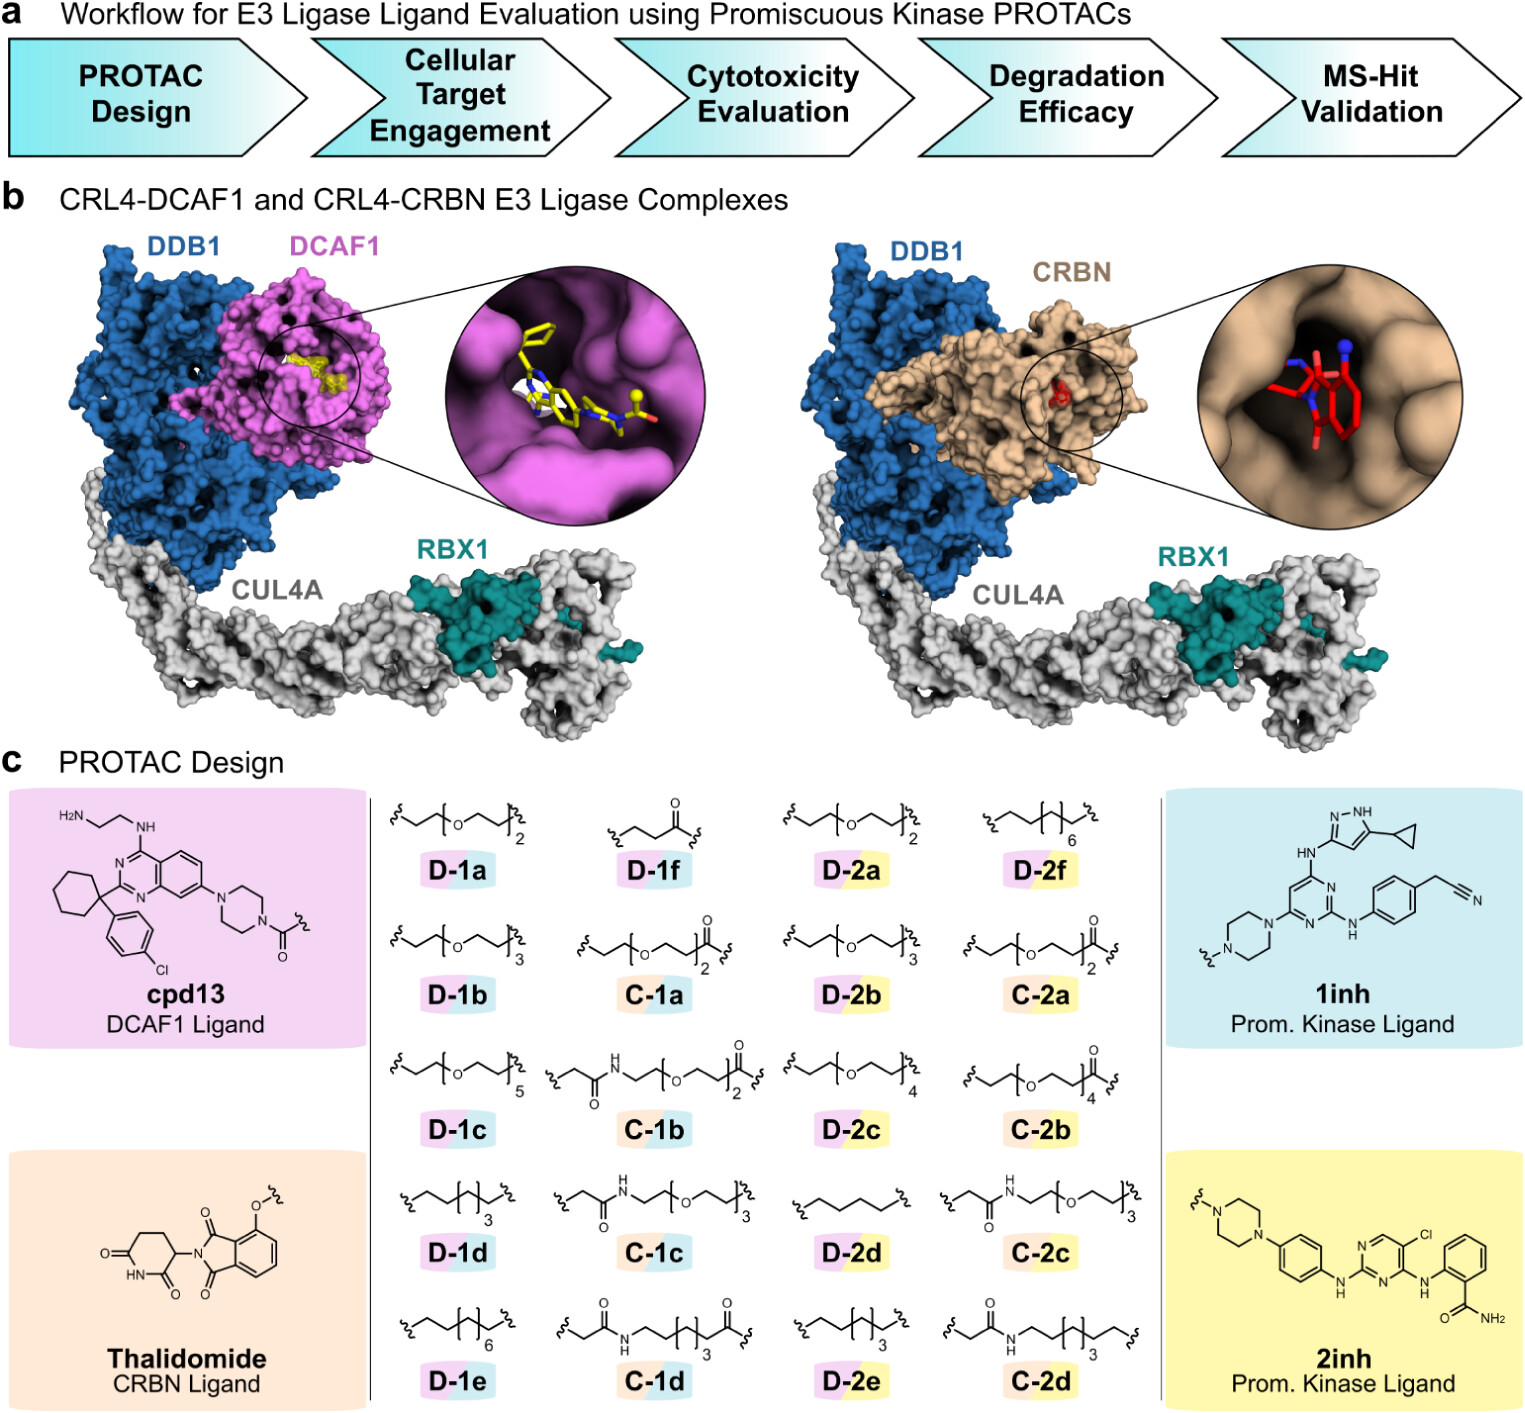
DCAF1 assembles a Cullin-RING ligase with DDB1, CUL4 and RBX, an architecture very similar to the CRBN complex, which proved to be extremely useful for TPD applications. So the only difference between both E3 ligase complexes is the substrate recognition domain, CRBN vs DCAF1, making them ideal for head-to-head comparison. DCAF1 belongs to the WD40 (WDR) family and is structurally very different from CRBN, which is then mirrored by different ligand chemotype.
Importantly, DCAF1 is essential for the survival of many cancer cells. Unlike CRBN, it cannot simply be switched off by the tumor, for example through promoter methylation, a documented resistance mechanism for CRBN- and VHL-based degraders. An E3 ligase the cancer cells cannot afford to lose is an attractive one for development of anti-cancer drugs.
So far, DCAF1 had been used for only a handful of highly degradable targets (BRD9, WDR5, BTK, LIMK1), and even WDR5 was only moderately degraded (Dmax around 23 to 49%). Whether it is broadly useful was unknown.
Mapping the degradable kinome using promiscuous kinase ligands
Rather than testing a single target, we designed PROTACs bearing broad-spectrum kinase inhibitors and E3 ligand we want to evaluate (DCAF1 or CRBN ligands in this case). This allowed us to target multiple kinases at once and measure their degradation by quantitative proteomics. This workflow actually isn’t new, as we have established it earlier using VHL PROTACs, which was also published (see my older post here).
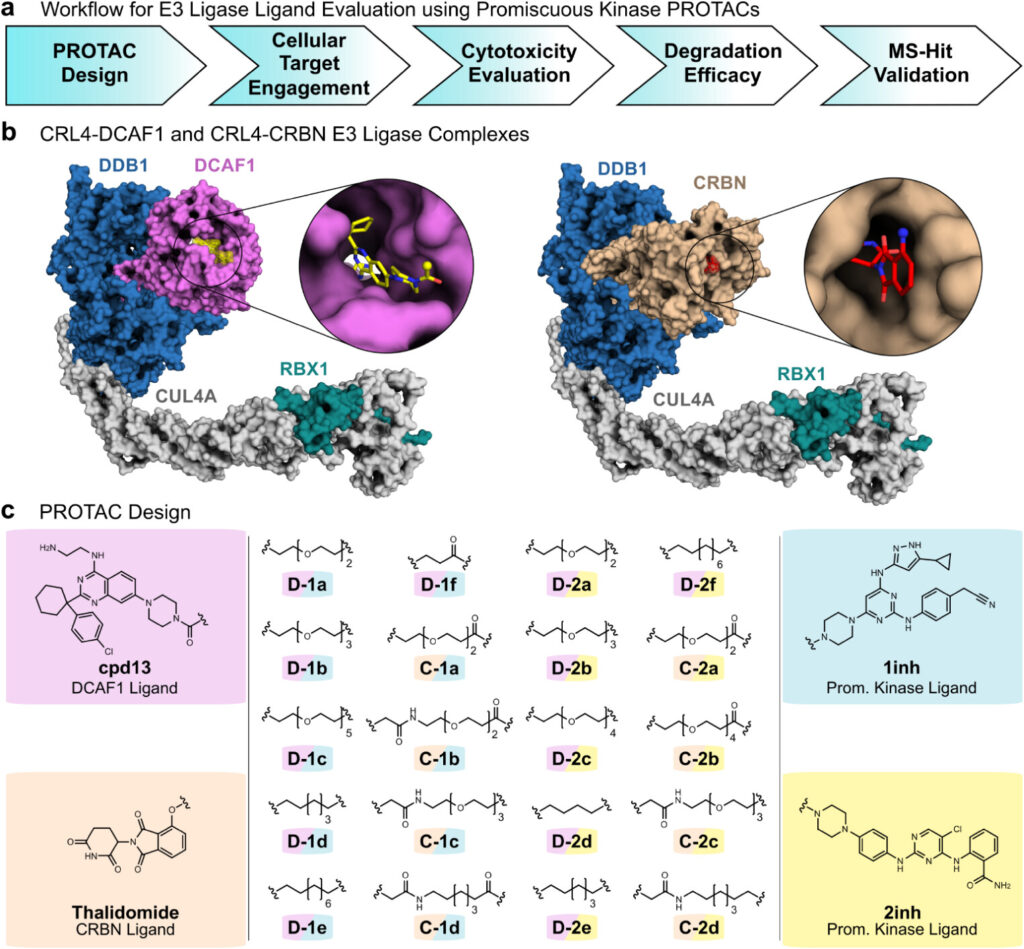
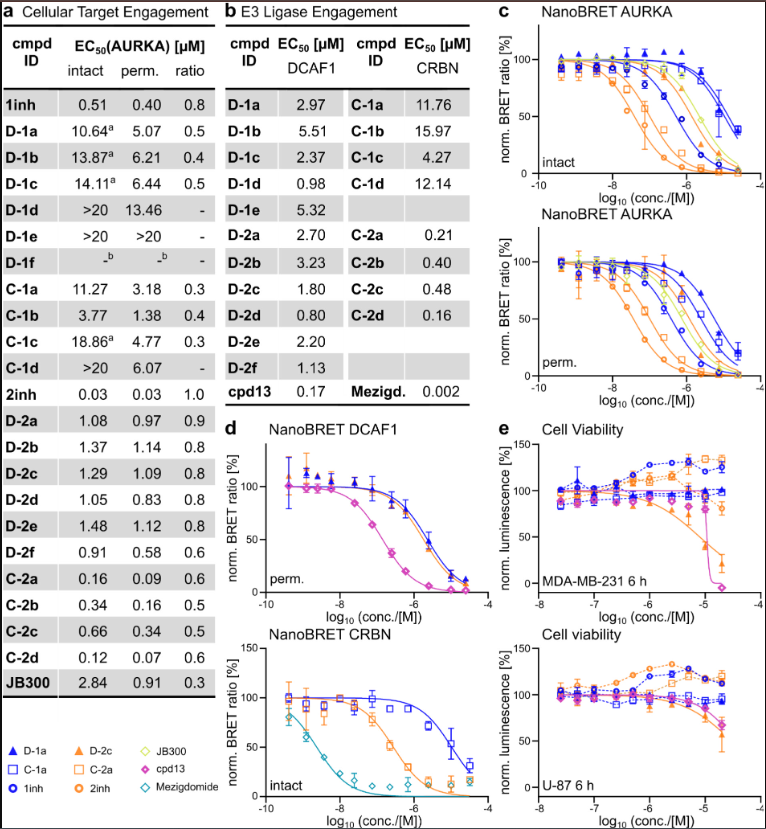
We synthesized a panel of 20 PROTACs, pairing two promiscuous kinase warheads (1inh and 2inh) with either the DCAF1 ligand cpd13 (developed by Novartis) or a CRBN ligand (derived from thalidomide). To cover decent range of possible ternary complexes, we employed PEG and alkyl linkers of various lengths. The CRBN series served as the benchmark. Both sets of PROTACs went through our workflow consisting of target engagement (NanoBRET), cytotoxicity testing, and selected PROTACs were further profiled using MS-proteomics and ubiquitinomics, followed by validation in orthogonal assays.
DCAF1 degrades a large slice of the kinome
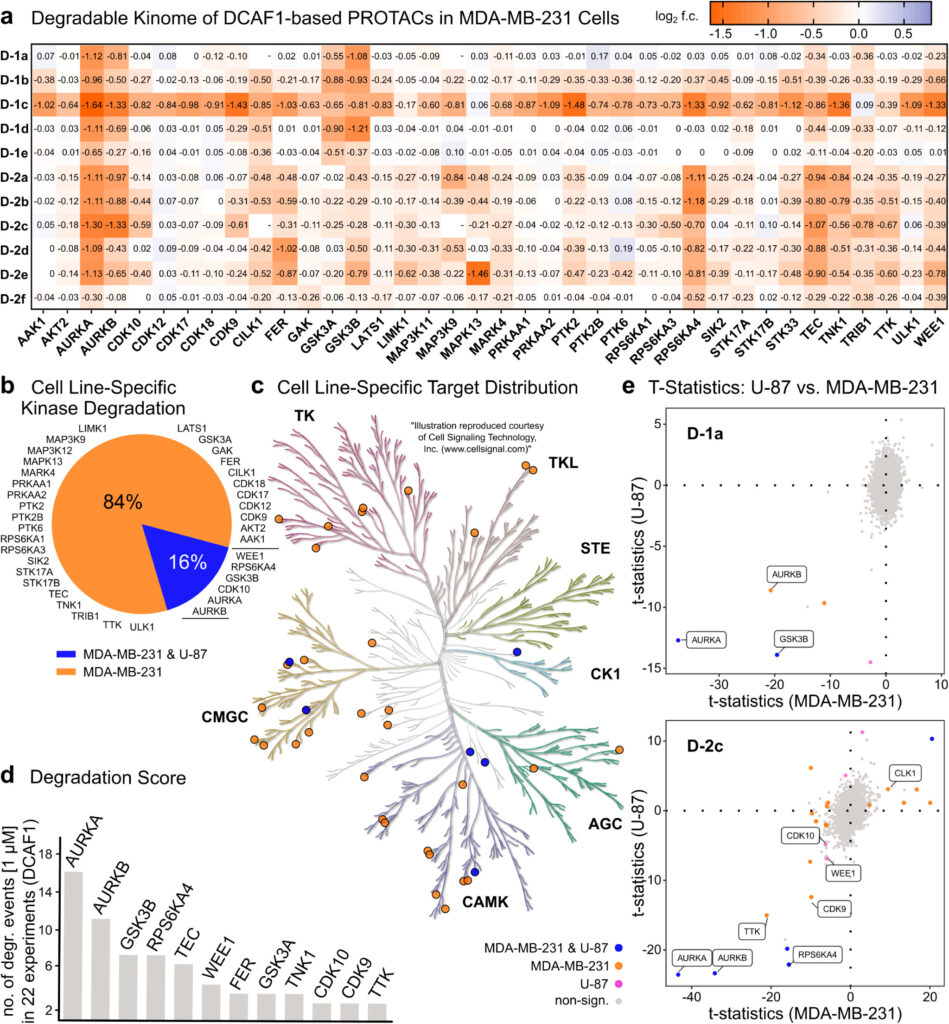
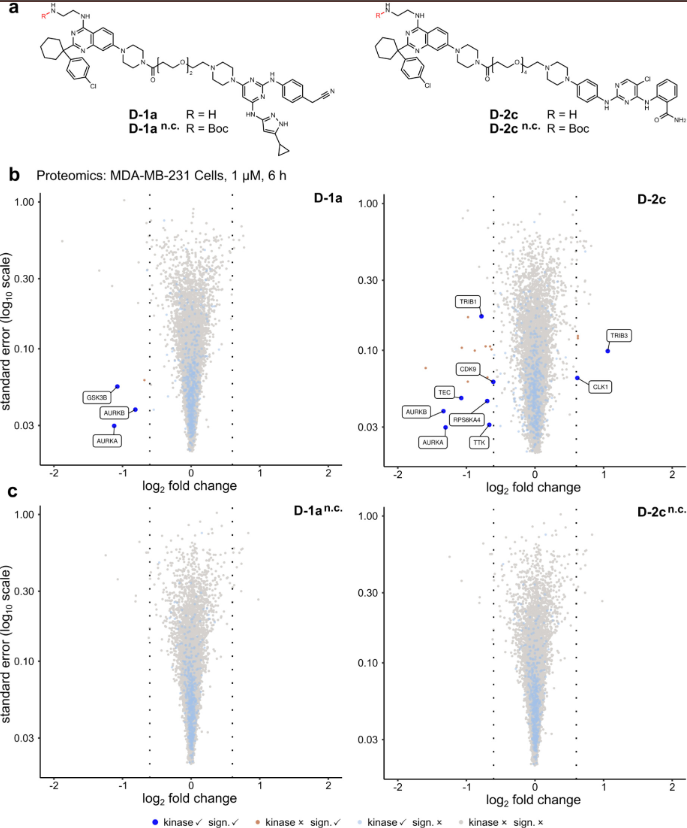
The key piece of data came from proteomics. At the -0.6 log2 FC (fold change) cutoff, the DCAF1 PROTACs degraded 38 different kinases from various families across the kinome (cells were treated with 1 µM concentration for 6 h). AURKA and AURKB were the most frequently and potently degraded targets. In addition to kinases, some DCAF1 PROTACs also degraded a few other nonkinase proteins, mostly known kinase partners such as the AURKA regulator INCENP or CDK-binding cyclins.
From the data it is clearly visible that cell line selection matters. The glioblastoma line U-87 was far less responsive, displaying only 16% of the kinases degraded by DCAF1 PROTACs, which were overlapping with MDA-MB-231 cell line. Thus, 84 % of the degraded kinases were observed only in MDA-MB-231 cell line. This finding correlated with the lower expression levels of DCAF1 in U-87 cells and also with broader coverage of expressed protein kinases in MDA-MB-231 cells. On the other hand the protein expression levels of individual kinases didn’t correlate with degradation potency.
In line with previously published findings for other E3 ligases, also our data demonstrate that degradation potency doesn’t correlate well with binary binding and is highly sensitive to linker variations. Although the 2inh warhead generally exhibited broader degradation thanks to its stronger binary complex and better cell penetration, the single most active degrader D-1c came from the weaker 1inh warhead. While some PROTACs showed low or no degradation activity, the most potent DCAF1 PROTAC D-1c degraded 34 of them.
For mechanistic validation we needed negative controls that truly do not bind DCAF1. The obvious strategy (earlier applied by Novartis), dimethylating the cpd13 amine, did not abolish binding (the dimethyl analogue still bound at EC50 = 3.65 µM). Therefore we installed a bulkier Boc group, which finally abrogated any measurable binding. Gratifyingly, these controls did not degrade any kinases, as visible in the volcano plots below, which is exactly what we wanted to see. In addition, co-treatment with the neddylation inhibitor MLN4924 fully rescued the kinases, confirming a cullin-dependent, ubiquitin-proteasome mechanism.
Head to head with cereblon
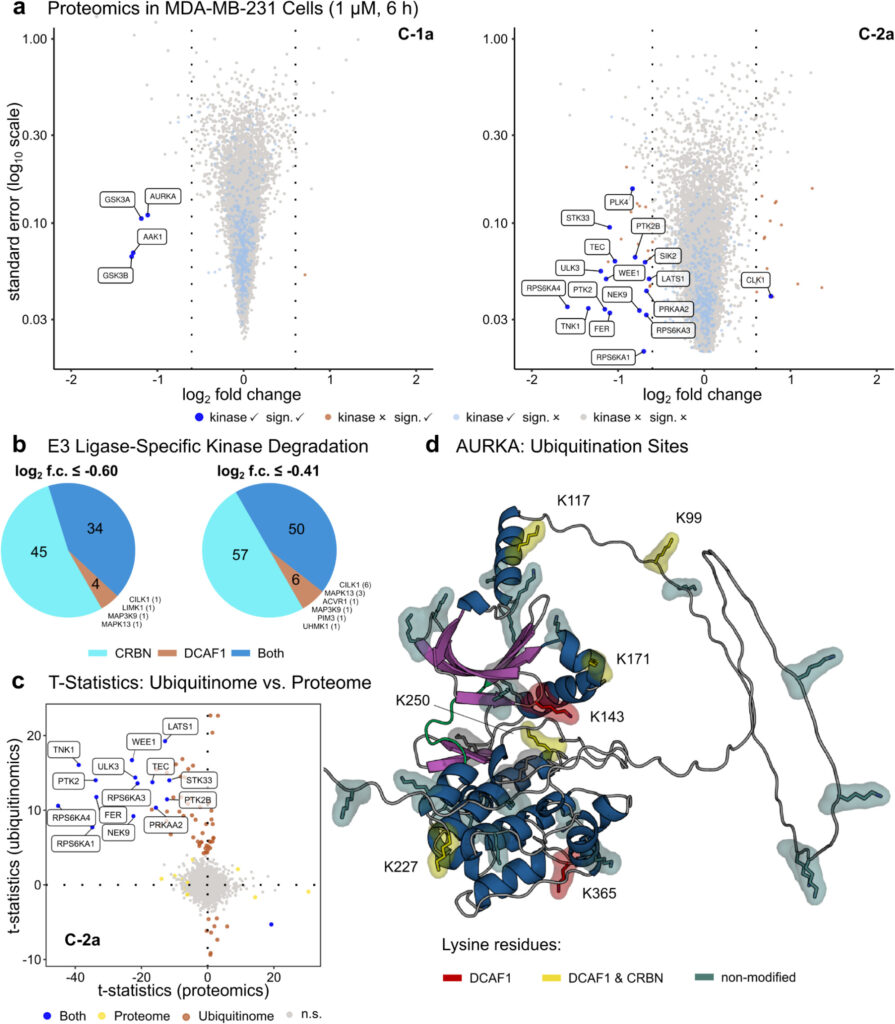
The most informative part, in my view, is the matched comparison with CRBN. Across all experiments with 12 DCAF1 recruiting PROTACs and 8 CRBN recruiting PROTACs, 83 kinases were degraded in total. Of these, 34 were degraded by both DCAF1- and CRBN-recruiting PROTACs, 45 only by CRBN, and only four (CILK1, LIMK1, MAP3K9 (MLK1) and MAPK13 (p38δ)) were unique to DCAF1 (at the stricter -0.6 log2 FC). So both PROTAC series hit a largely overlapping space, with DCAF1 covering a somewhat narrower slice. The higher and broader degradation activity of CRBN series we attribute (at least partially) to its tighter E3 engagement and better cell penetration. The degradation profile was also warhead-dependent, since with 1inh warhead the two ligases performed similarly, while the more potent 2inh warhead showed clearly broader degradation profile for the CRBN series.
Remarkably, the DCAF1 PROTACs degraded CILK1, a kinase never before targeted by a PROTAC or any small molecule.
The thalidomide-based CRBN PROTACs degraded the expected thalidomide neo-substrates, whereas neither the DCAF1 PROTACs nor cpd13 itself showed any neo-substrate or molecular-glue activity at the proteome level, which has clear implications for drug discovery programs.
Ubiquitinomics
To deconvolute whether the observed protein depletions are a result of a direct ubiquitin-dependent degradation or secondary downstream effects, we ran ubiquitin-diGLY proteomics (ubiquitinomics) at an early 30-minute time point, since ubiquitination is much faster than degradation. The results show that kinase ubiquitination correlated well with kinase degradation, supporting the direct PROTAC-mediated degradation. However, we also detected ubiquitination of additional kinases that were not significantly degraded in the proteomics, suggesting that the chain length, frequency or linkage of the marks was simply not enough to commit those kinases to the proteasome. The mostly inactive PROTACs D-1e and D-2f showed no kinase ubiquitination at all, consistent with the inactivity in proteomic experiments and hinting at a failure to form productive ternary complexes or problems with solubility or cell membrane penetration.
The scope of ubiquitination across different lysine residues nicely tracked degradation efficacy, with PTK2 as a good illustrative example. While the DCAF1 PROTAC D-2c installed ubiquitin(s) at five different lysines on PTK2 and failed to degrade it, the CRBN PROTAC C-2a covered eleven different residues, leading to efficient degradation. In the case of AURKA, DCAF1 PROTACs D-1a and D-2c induced potent degradation together with abundant ubiquitination, whereas CRBN PROTAC C-2a showed the opposite, weak degradation as well as weak ubiquitination.
Interestingly, mapping the AURKA sites showed that ubiquitination occurred mostly on the face opposite the PROTAC-E3 interaction and on structured regions, with several lysines (for example K99, K117, K171, K227 and K250) shared between both ligases, but a couple of lysines (K143 and K365) were modified only upon DCAF1 recruitment.
Does it mean that different E3 ligases induce different ubiquitination patterns on the same target? While the data points this direction and mechanistically it makes sense, one should be careful before drawing hard conclusions due to complexity of the system.
Of note, this experiment demonstrates that the ubiquitinomics can be very powerful tool for probing the mechanism of action on proteome-wide level. This can be useful for other TPD projects, helping to dissect the effects behind protein depletion before you invest in the development of orthogonal assays for several targets individually.
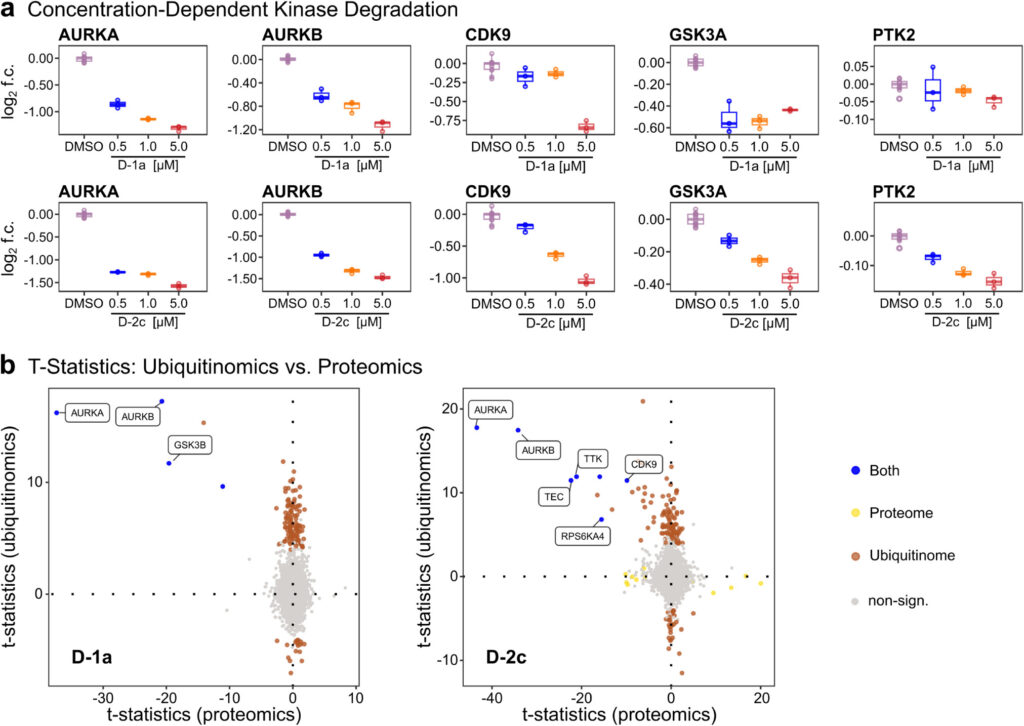
changes (proteomics) for selected kinases induced by PROTACs D-1a and D-2c in MDA-MB-231. Results for U-87 cells are given in Figure S20.
(b) T-statistic comparison of the altered ubiquitinomes and proteomes for D-1a and D-2c.
Orthogonal assays
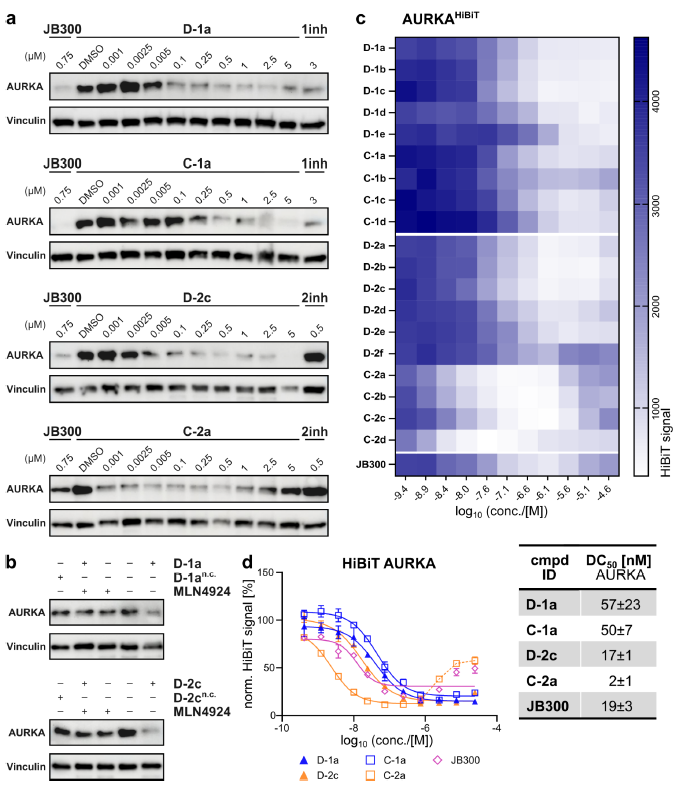
To make sure the proteomics readout reflects PROTAC mediated degradation rather than an artifact, we confirmed the key hits with orthogonal assays based on independent detection methods. Taking AURKA as a representative target, we followed its degradation in nanoluciferase reporter cell lines, by Western blot on the endogenous protein, and in a HiBiT assay. All three were consistent with the proteomics, and together with the inactive negative controls they confirmed that the degradation is PROTAC-driven. Remarkebly, even our non-optimized DCAF1 PROTAC D-2c degraded AURKA with a DC50 of 17 nM, essentially matching the optimized, purpose-built AURKA degrader JB300 (19 nM).
DCAF1 vs CRBN ligands
Where DCAF1 currently pays a price is the ligand itself. Although three different chemotypes have been disclosed by Novartis, OICR and Cyclica, none of them has optimal drug-like or activity profile (based on partially unpublished data).
Originally I wanted to compare all three DCAF1 ligands vs thalidomide but due to limited resources we proceeded with Novartis’s cpd13 “only”, which still required extensive (and expensive) characterization and synthetic effort.
While ligands from Novartis and OICR show in vitro potency in low nanomolar range, they possess some limitations such as relatively high molecular weight (compared to CRBN ligands), higher count of rotatable bonds and H-bond donors which impairs the drug-likeness of corresponding PROTACs. Consequently, we have observed poor cell penetration of the DCAF1 ligand itself leading to lower cellular activity. Non-negligible is also higher synthetic complexity of both DCAF1 chemotypes, compared to relatively simple CRBN ligands . In addition, subsequent functionalization (linker attachment) of Novartis ligand is tricky due to low solubility.
Regarding Cyclica DCAF1 ligand which was published in the past, its synthesis is comparatively easier and has lower molecular weight, but its potency is way too low and we observed some unexpected behavior which might be a possible topic for another future publication (stay tuned).
Another aspect that speaks for DCAF1 ligands is chemical stability, as CRBN ligands typically contain problematic glutarimide moiety. In addition, DCAF1 offers more flexibility for medchem design and optimization since its WD40 domain accommodates ligands of diverse chemotypes.. Importantly, it carries no neo-substrate baggage, although newer optimized CRBN ligands have addressed that issue too.
There is definitely space for further improvement of the existing DCAF1 ligands. One of the possible directions for optimization of drug-like properties is bioisosteric replacement of the primary amine, which is not only increasing H-bond donor count but also might be metabolic soft spot. The tricky part is that this amine also creates important interaction with the DCAF1.
Final comments
Before we draw some conclusions, it’s important to highlight the complexity of the studied system. PROTAC mediated degradation is catalytic, event driven process with many elemental steps and processes that need to happen before a protein gets digested by 26S proteasome. And all of it happens in complex biological organism (moody cells, or animals) under the hands of a student who mixed up samples last Saturday evening.
Although we tried to sample the conformations of possible ternary complexes through linker variations with consistency across both E3 ligases and kinase warheads, we need to keep in mind that the substrate recognition domains, DCAF1 and CRBN, have quite different architecture and therefore different propensity to form ternary complexes. Besides that there are many additional factors that make the “direct” comparison difficult. Yet, there are valuable findings and lessons.
So what’s the final verdict, is CRBN better than DCAF1? It’s not that simple and it’s not black and white. Although the pool of degraded kinases from proteomic experiments was approx. twice as bigg for CRBN series, the DCAF1 series showed a decent target coverage across the kinome. So considering the current limitations in the physicochemical properties of DCAF1 ligand and their corresponding PROTACs, the results can get much better once we find better (smaller, membrane penetrant) DCAF1 ligands. Already now, with suboptimal DCAF1 ligand, we observed high degradation activity of non-optimized DCAF1 PROTAC on AURKA with 17 nM DC50.
While there was significant overlap with CRBN series, there were a few targets that were degraded only by DCAF1 series, suggesting that for some targets, DCAF1 might be a better match. This is also in line with the different ubiquitination pattern across lysines on the protein surface.
The follow up question is whether the significant overlap in degraded kinases is due to analogous arrangement of both E3/E2 ligase complexes or whether their degradability in more general?
I expect DCAF1 to become a serious option next to CRBN or VHL. DCAF1 is essential in many cancers and therefore harder to silence as a resistance route, which makes recruitment of this E3 ligase for TPD especially interesting for anti-cancer drug discovery.
Share your opinion
Would you build your next PROTAC project around DCAF1? How would you approach medchem optimization of the current ligands? And which emerging E3 ligase/ligand do you think deserves a proper, broad validation next?
Let me know your thoughts under my LinkedIn post here.
Full paper: https://doi.org/10.1021/acs.jmedchem.6c00383